 |
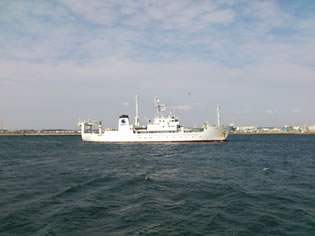
| Fig. 1. FRV Soyo-Maru. |
We carried out a research cruise SO1304 using FRV Soyo-Maru (FRA) during Apr. 16-24. SKED members on board are H. Saito, Y. Okazaki, H. Miyamoto, K. Hidaka, K. Komatsu, Y. Hiroe, K. Nagai, T. Hirata.
 |
| Fig. 2. Sampling stations along two survey lines. Red arrow means the position of Kuroshio. |
We set a couple of survey lines off Omaezaki (SO-line) and the Boso Peninsula (SB-line) which crossing Kuroshio (red arrow).
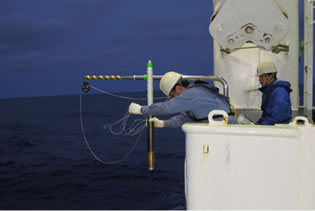
In the SO1204 cruise, we used various physical oceanographic sensors, such as underway CTD (Fig. 3), turbulence microstructure acquisition profiler (Fig. 4) in addition to routine oceanographic observations (e.g., CTD-RMS, Norpac-net, MOHT trawl) in order to understand fine scale physical characteristics of the Kuroshio and to determine the mechanism of nutrient supply to the surface mixed layer.
 |
 |
|
Fig. 3. Underway CTD. |
Fig. 4. Turbulence microstructure acquisition profiler (left) and its sensors (right). |
Vertical transects of chlorophyll a (top) and nitrate concentration (bottom). Arrows mean the position of the Kuroshio axis.
 |
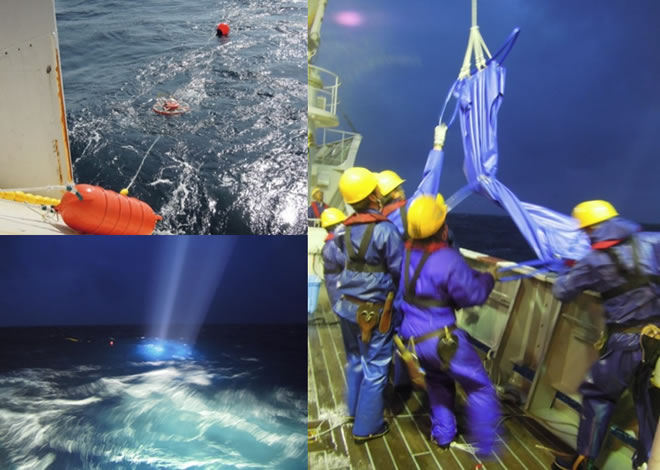
We drifted a multi-sensor buoy at the Kuroshio. After 16 hours of the drifting, a weather got worse, and we decided to suspend the observation. The officer and crew struggled for recovering the equipment under rough sea condition.
 |
 |
 |
|
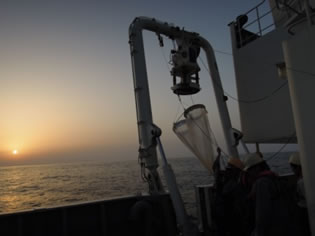
Twin NORPAC-net sampling for zooplankton |
MOHT Trawl for larval fish sampling |
 |
 |
|
Researchers waiting for NORPAC net recovery |
CTD-RMS sampling |


